In my years immersed in technology, I’ve noticed a recurring theme: the tools and paradigms we employ to solve problems are constantly evolving. Not always because the old ways were inadequate, but often because we find a new perspective or method that better aligns with the challenges we face. Such is the case with the shift some of us are making from traditional relational databases to graph databases.
The Basic Premise
Relational Databases (RDBMS): Organized, structured, and rigid. These have been the cornerstone of data persistence for decades. With tables, rows, and columns, the paradigm is akin to a well-organized ledger or spreadsheet.
Graph Databases: In a graph database, data is no longer confined to rows and columns. Instead, it’s stored as nodes (the entities) and relationships (the connections between these entities). This shift in perspective isn’t about reinventing the wheel; it’s about using a different kind of wheel for a different kind of road.
Let’s explore this shift in more detail.
Consider an online marketplace—a platform with products, suppliers, and various attributes. In a relational setup, you’d likely start with a Products table, a Suppliers table, and perhaps a joining table Supplier_Product.
In the graph realm, the visualization becomes more direct. Each product is a node. Each supplier is a node. The act of supplying becomes the relationship.
Let’s complicate things a bit. Say each product has customizable options provided by different suppliers, or the option to print unique designs, facilitated by yet another type of supplier.
In a relational setup, you’d find yourself building more tables, more foreign keys, more relationships. The design can become unwieldy, especially as new complexities arise.

In this relational model, products have direct links to customizations through the Product_Customization joining table. Products are also linked to suppliers via the Supplier_Product joining table, and customizations have their suppliers through the Supplier_Customization table.
However, in a graph database, this complexity doesn’t necessarily mean more “tables.” It might mean more nodes, or perhaps richer relationships, but the model remains intuitive. The data representation becomes more intuitive and visual. If you’ve executed the queries in Neo4j and taken a screenshot, it’d illustrate a web of connections:
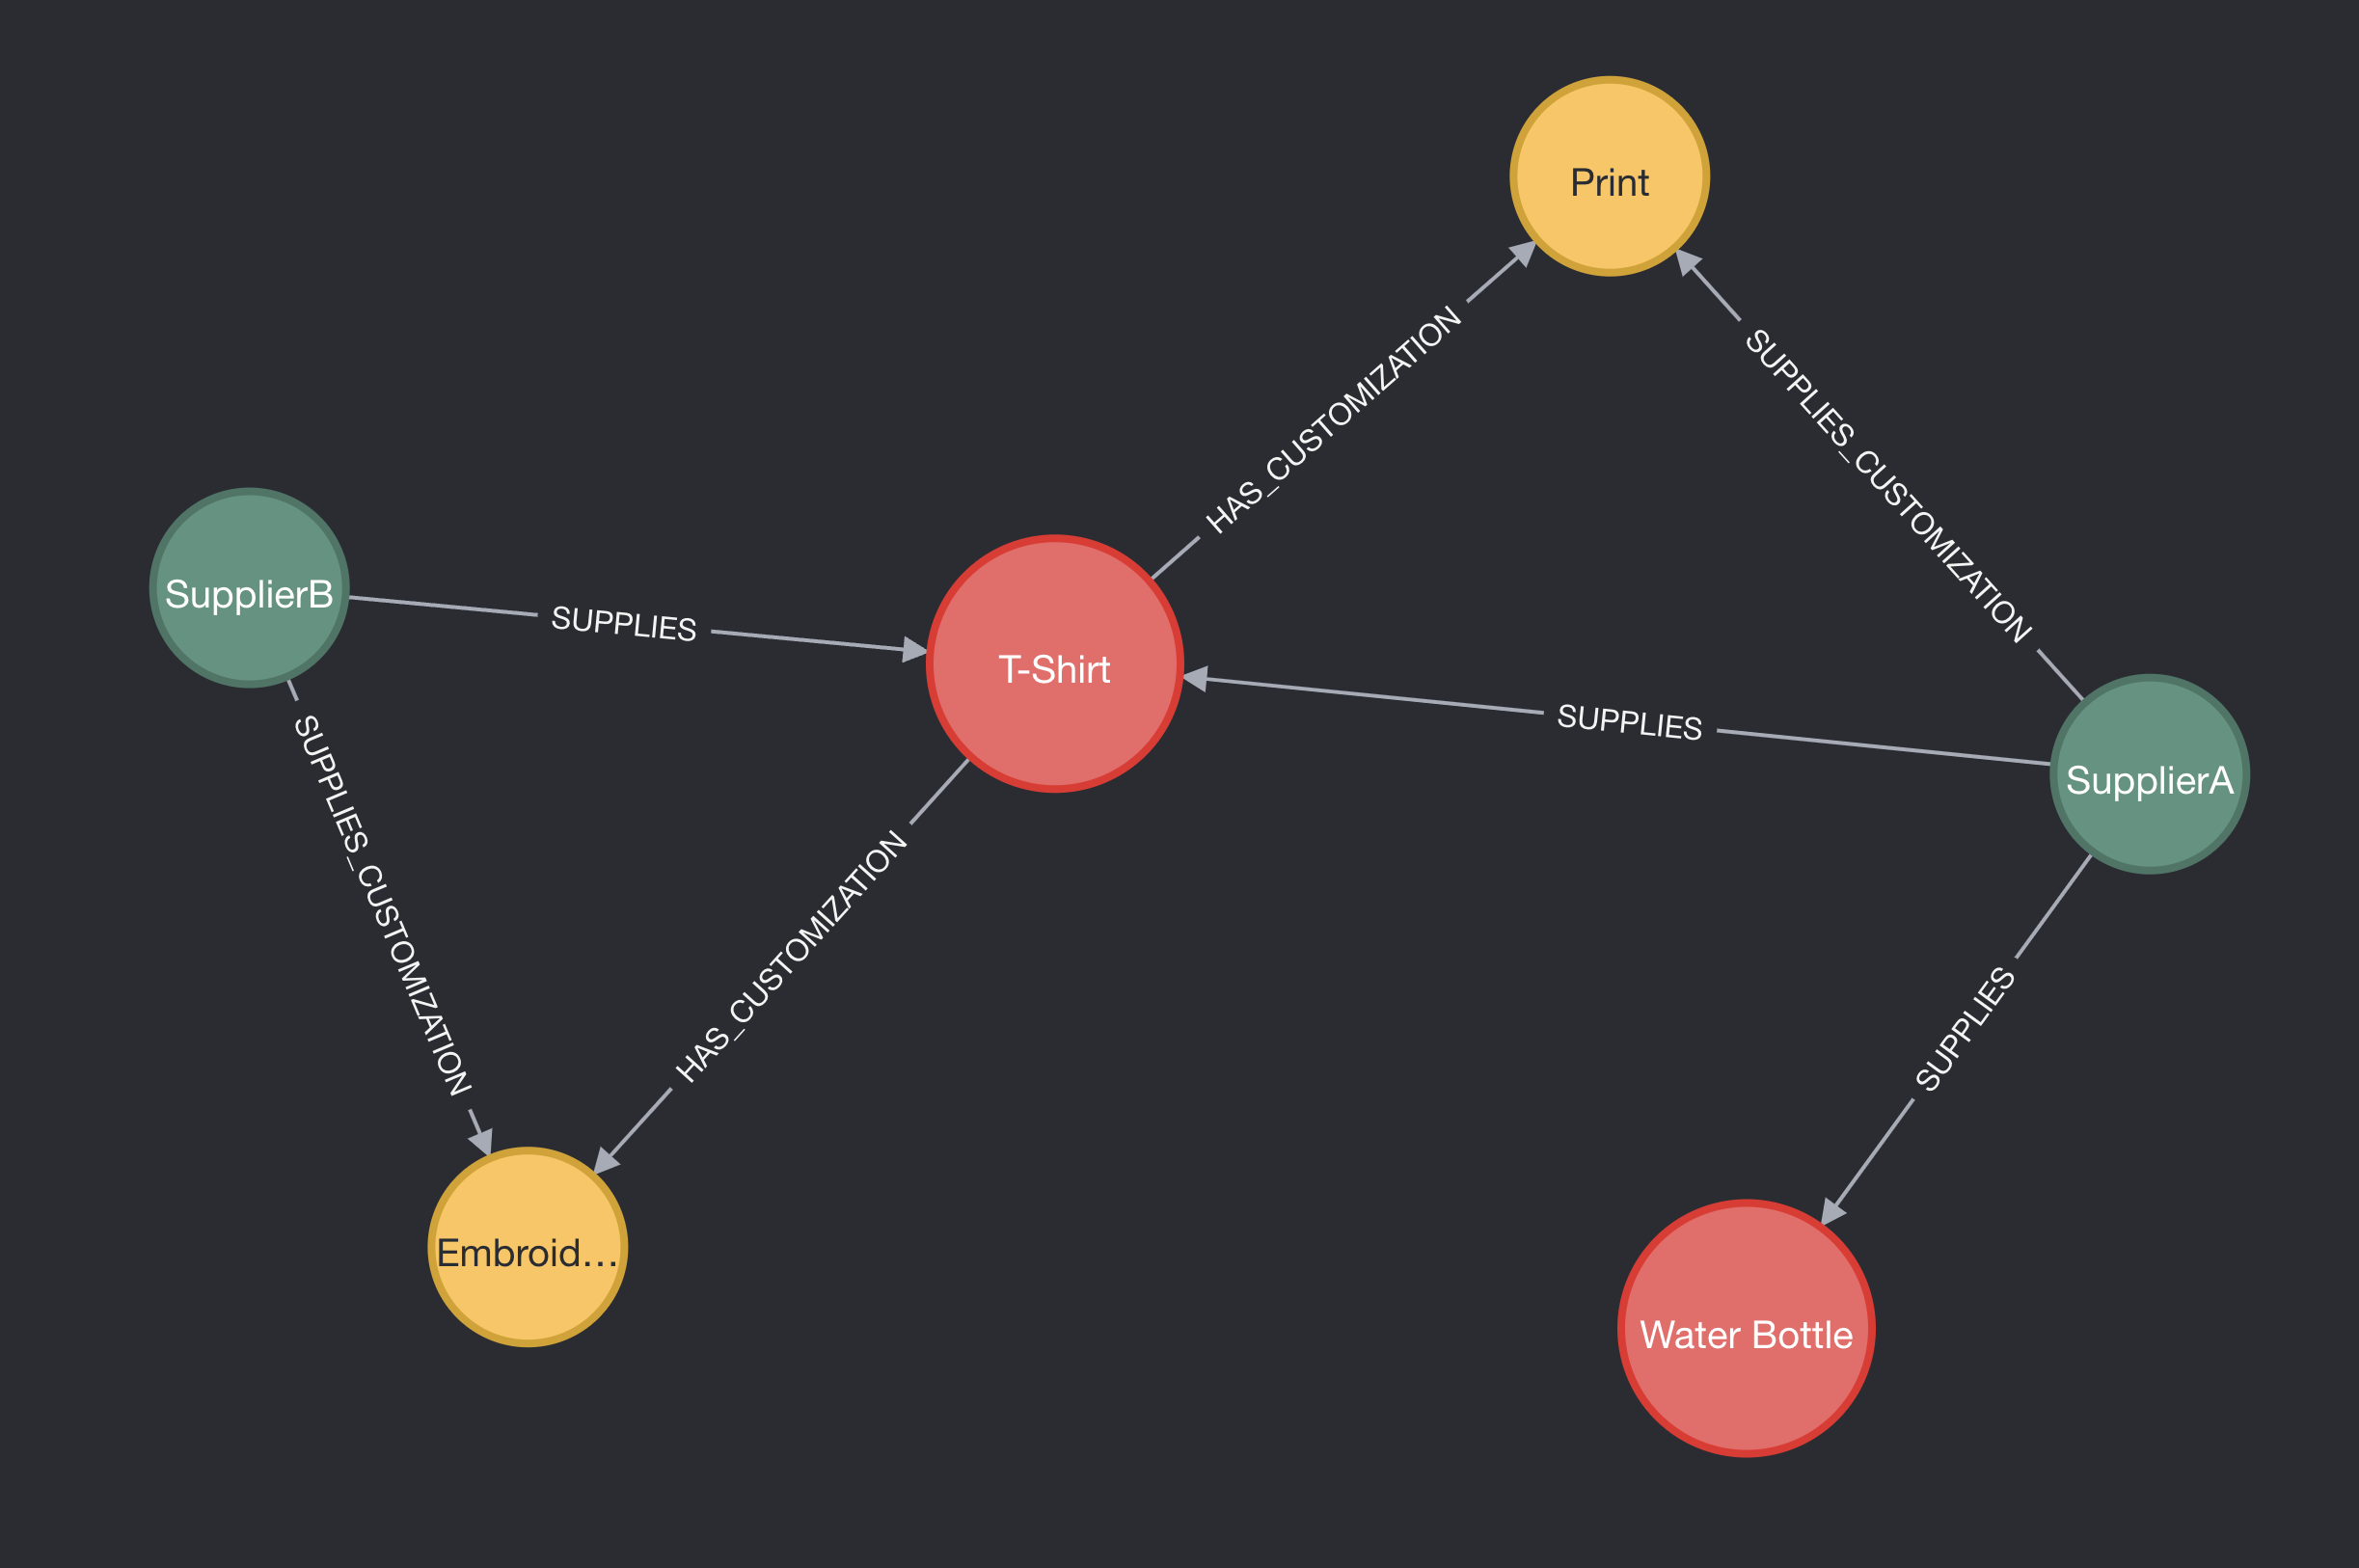
- Products like
T-ShirtandWater Bottleare nodes. - Suppliers are also nodes.
- The act of supplying, or providing a customization, is the relationship.
You’d visually witness how SupplierA supplies a T-Shirt and how that T-Shirt has a Print customization, provided by the same or perhaps a different supplier.
Querying: SQL vs. Graph
Imagine we want to find all suppliers who provide a certain customization option for the product T-Shirt.
In a relational database like MySQL, the query could be constructed as:
SELECT s.name
FROM Suppliers s
JOIN Supplier_Customization sc ON s.SupplierID = sc.SupplierID
JOIN Customizations c ON sc.CustomizationID = c.CustomizationID
JOIN Product_Customization pc ON c.CustomizationID = pc.CustomizationID
JOIN Products p ON pc.ProductID = p.ProductID
WHERE p.name = 'T-Shirt';
Even for those familiar with SQL, it’s evident that several table joins are required to navigate this relationship web. The structure is rigid, and as the database schema becomes more complex, the queries will similarly increase in complexity.
Now, let’s examine how we’d extract the same information using Neo4j’s Cypher query language:
MATCH (p:Product {name: 'T-Shirt'})-[:HAS_CUSTOMIZATION]->(c:Customization)<-[:SUPPLIES]-(s:Supplier)
RETURN s.name;
The Cypher query flows almost like a sentence, tracing the path from the product to the customization and the suppliers who offer it. It’s inherently visual and tends to scale gracefully with complexity.
While both SQL and Cypher achieve the desired result, the way they approach the task differs significantly:
- Structural Visualization: Cypher queries, being descriptive of the data’s actual shape, offer a clearer picture of the data structure. You’re essentially tracing the path through the graph.
- Simplicity with Complexity: As our database grows and becomes more intricate, SQL queries tend to lengthen and become more convoluted, whereas Cypher maintains a more consistent form.
- Flexibility: Graph databases don’t get bogged down with the rigid table structures of relational databases. This makes it easier to adapt to changing data requirements.
I’ve observed that technology is less about the tools themselves and more about knowing when and how to use them. Graph databases aren’t a replacement for relational databases, but another tool in our ever-expanding arsenal.
It’s worth exploring, understanding, and, if it aligns with your challenges, embracing. After all, innovation isn’t merely about invention—it’s about timely adaptation.
Stay curious.